⚡BTC Golden Cross Appearance🔀
☕️ GM Dear Plebs!
Here is Crox Road, your daily dose of orange pill that will turn you into a Bitcoin Maxi.
The menu for today:
🌟 Bitcoin's Golden Cross
Bitcoin has had an impressive month, marking its second-largest gain of the year and signalling a new phase of upward momentum. It's currently trading at around $34,545, showing a modest daily increase after rebounding from a low of $34,000. October has been a standout month for the Market , with a remarkable 28% rise in its value, making it one of the best months in 2023, only surpassed by January's 40% increase. Analysts attribute this success to a maturation of volatility levels, as more institutional investors are entering the market, balancing out the historically retail-oriented nature of Bitcoin. Pedro Lapenta, head of research at Hashdex, noted that Bitcoin has often rewarded investors during periods of low volatility. A significant development this month is the appearance of a "golden cross" on the daily chart, a technical indicator that's grabbing the attention of traders and analysts, suggesting further bullish sentiment in the market.
The golden cross is a bullish signal that occurs when a short-term moving average, typically the 100-day, crosses above a long-term moving average, like the 200-day. Historically, this pattern is seen as a strong indicator of an upcoming upward trend and is often accompanied by increased trading volumes.
Matteo Greco, a research analyst at Fineqia International, a publicly listed digital asset and fintech investment firm, highlighted Bitcoin's outstanding performance compared to other digital assets. Bitcoin's dominance has increased by 1.7% over the past week, marking the fifth consecutive week of growth and pushing it past the 54% mark.
This dominance is also reflected in the total digital assets market cap, which currently stands at $1.33 trillion, similar to the figure recorded in mid-July at $1.22 trillion. Greco pointed out that despite the recent price increase in Bitcoin, the total market cap remains relatively stable, suggesting that the surge in Bitcoin's price is more about a shift of capital from other cryptocurrencies to Bitcoin rather than a net inflow of new funds into the market.

🤩 MicroStrategy Adds to Bitcoin Stash
MicroStrategy, a well-known business intelligence and software company, is sticking to its plan of investing in Bitcoin. They've just announced their latest move, buying an additional 155 Bitcoins for $5.3 million. This comes at a time when Bitcoin's price has been on the rise, hitting a recent high of $35,000.
MicroStrategy initially entered the world of Bitcoin in August 2020, making a massive investment of $250 million into BTC. Since then, they've been consistently adding to their Bitcoin holdings, following a treasury reserve strategy that has now accumulated over 158,400 Bitcoins, worth more than $5.4 billion as of now. They've acquired 6,067 Bitcoins since the end of the second quarter, spending $167 million on these purchases.
Andrew Kang, MicroStrategy's Chief Financial Officer, emphasised their strong commitment to acquiring and holding Bitcoin, especially with the potential for increased institutional adoption. It's worth noting that the upcoming fourth Bitcoin halving and the possibility of the SEC approving the first spot Bitcoin ETF are further motivating MicroStrategy to maintain their aggressive Bitcoin investment strategy, showing no signs of slowing down in their crypto endeavours.

🌊 High Wave
The high wave candlestick pattern is a visual clue in the world of trading that tells us the market is in a state of uncertainty. It basically means that neither the bullish buyers nor the bearish sellers are in clear control. This pattern tends to pop up around support and resistance levels, which are key battlegrounds where the two sides, the bears and the bulls, are duking it out to see who can push the price in their favour.
What makes the high wave pattern stand out are the long shadows (those lines above and below the small central part) – these tell us there was a lot of price action during that time, but in the end, the price pretty much landed back where it started, near the opening price. In a nutshell, the high wave pattern highlights a market that's having a tug-of-war, with no clear winner in sight. It's a sign for traders to exercise caution and be aware of this market uncertainty.

🤣 Crox Road Memes
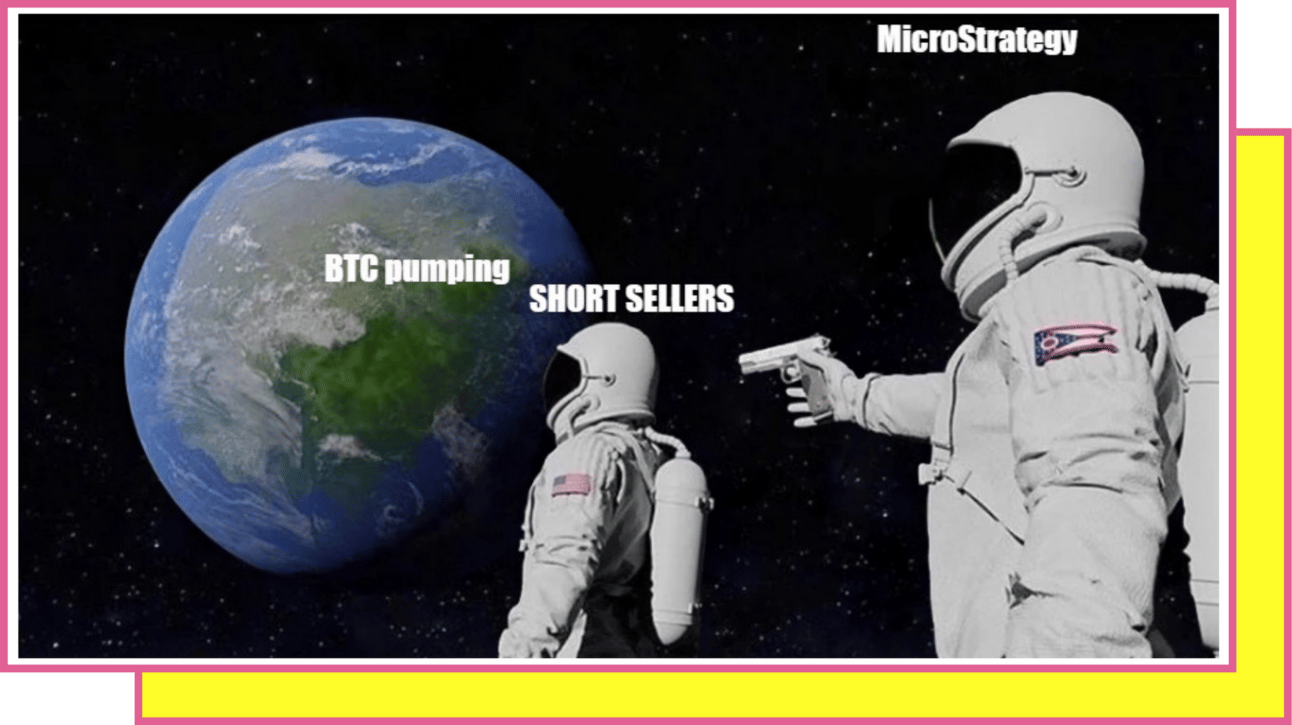

“Where there is Bitcoin, there is faith. Where there is faith, miracles happen.”