Why Bitcoin's Bollinger Bandwidth Signals a Potential Price Surge
The cryptocurrency market is notorious for its high volatility, with prices capable of making dramatic swings within very short time frames. This characteristic, while being a source of risk, also presents unique opportunities for traders and investors. Among the plethora of analytical tools and indicators at their disposal, Bollinger Bands have emerged as a particularly popular method for gauging market sentiment and potential price movements, especially in the context of Bitcoin, the flagship cryptocurrency. The recent focus has shifted towards a specific aspect of this tool: the Bollinger Bandwidth. This metric has been signaling a potential price surge for Bitcoin, drawing attention from market participants worldwide. Understanding why this indicator is currently in the spotlight and what it potentially foretells for Bitcoin can provide valuable insights for those involved in the cryptocurrency markets.
Table of Contents

Understanding Bollinger Bands and Bandwidth
Bollinger Bands are a staple in financial market analysis, offering a dynamic perspective on price movement and volatility. By providing a relative definition of high and low prices, these bands help users identify extremes and potential turning points in market trends. The construction of Bollinger Bands involves a set of three curves: the central line denotes the simple moving average (SMA) of the asset's price, typically over the last 20 periods. This average provides a baseline for understanding market direction. The upper and lower bands, plotted two standard deviations away from the central SMA, adapt to market conditions by widening during periods of high volatility and contracting during quieter times. This dynamic nature makes Bollinger Bands particularly useful in the fast-moving cryptocurrency markets.
The Bollinger Bandwidth, specifically, quantifies the width of the bands. A lower Bandwidth value indicates a narrow gap between the upper and lower bands, typically seen during periods of low volatility or market consolidation. Conversely, a high Bandwidth value suggests that the bands are wide apart, reflecting high market volatility. For traders, changes in the Bandwidth can signal shifts in market behavior, with narrowing bands often preceding significant price breakouts. In the context of Bitcoin, which is known for its rapid price changes and speculative waves, understanding and interpreting Bollinger Bandwidth can provide critical insights into upcoming market dynamics.
Historical Patterns and Bitcoin's Price Movements
The relationship between Bollinger Bandwidth and Bitcoin's price movements is not merely theoretical. Historical data reveals a compelling pattern: significant Bitcoin rallies often follow periods of low Bandwidth, where the market appears to be in a state of compression. This phenomenon can be likened to a coiled spring; as market pressure builds within a narrow price range, the potential for a sudden release—in the form of a sharp price movement—increases. This pattern is rooted in the psychology of market participants. During periods of low volatility, the uncertainty and anticipation build among traders and investors, leading to a tense equilibrium. Once a catalyst arrives—be it a major news announcement, a shift in regulatory landscape, or a change in market sentiment—the price can explode in the direction of the prevailing trend.
The historical bull runs of Bitcoin, particularly those observed in 2016 and late 2020, serve as prime examples. Prior to these periods of explosive growth, the Bitcoin market experienced phases of contraction, where prices moved within a tight range, leading to reduced Bollinger Bandwidth. These were times of uncertainty and speculation, with market participants closely watching for signs of a breakout. When the breakouts occurred, they initiated powerful trends that attracted even more participants, fueling the rallies. Understanding these patterns, and the role of Bollinger Bandwidth in identifying them, is crucial for market participants looking to anticipate significant price movements in Bitcoin.
Current Market Conditions and Bollinger Bandwidth
The recent interest in Bitcoin's Bollinger Bandwidth stems from observations that mirror the prelude to previous market rallies. The Bandwidth has been observed to narrow significantly, suggesting that Bitcoin is currently in a phase of market consolidation. This is a critical observation for traders and investors alike, as history has shown that such phases often precede substantial price movements. However, it's important to approach this indicator with caution. While a narrowing Bandwidth suggests the potential for a significant price move, it does not dictate the direction. The cryptocurrency market is influenced by a myriad of factors, including technological developments, regulatory changes, and shifts in investor sentiment. These factors, combined with global economic conditions, can significantly impact Bitcoin's price direction following a period of consolidation.
Moreover, the current global economic landscape presents a complex backdrop for Bitcoin and other cryptocurrencies. Issues such as inflation rates, monetary policy shifts, and geopolitical tensions play a role in shaping investor sentiment and market dynamics. In this context, the Bollinger Bandwidth serves as a tool for alerting investors to the heightened potential for volatility and significant price movements. However, interpreting what these movements might entail requires a comprehensive analysis that incorporates a wide range of market indicators and global economic factors.

Analysts' Outlook and Market Sentiment
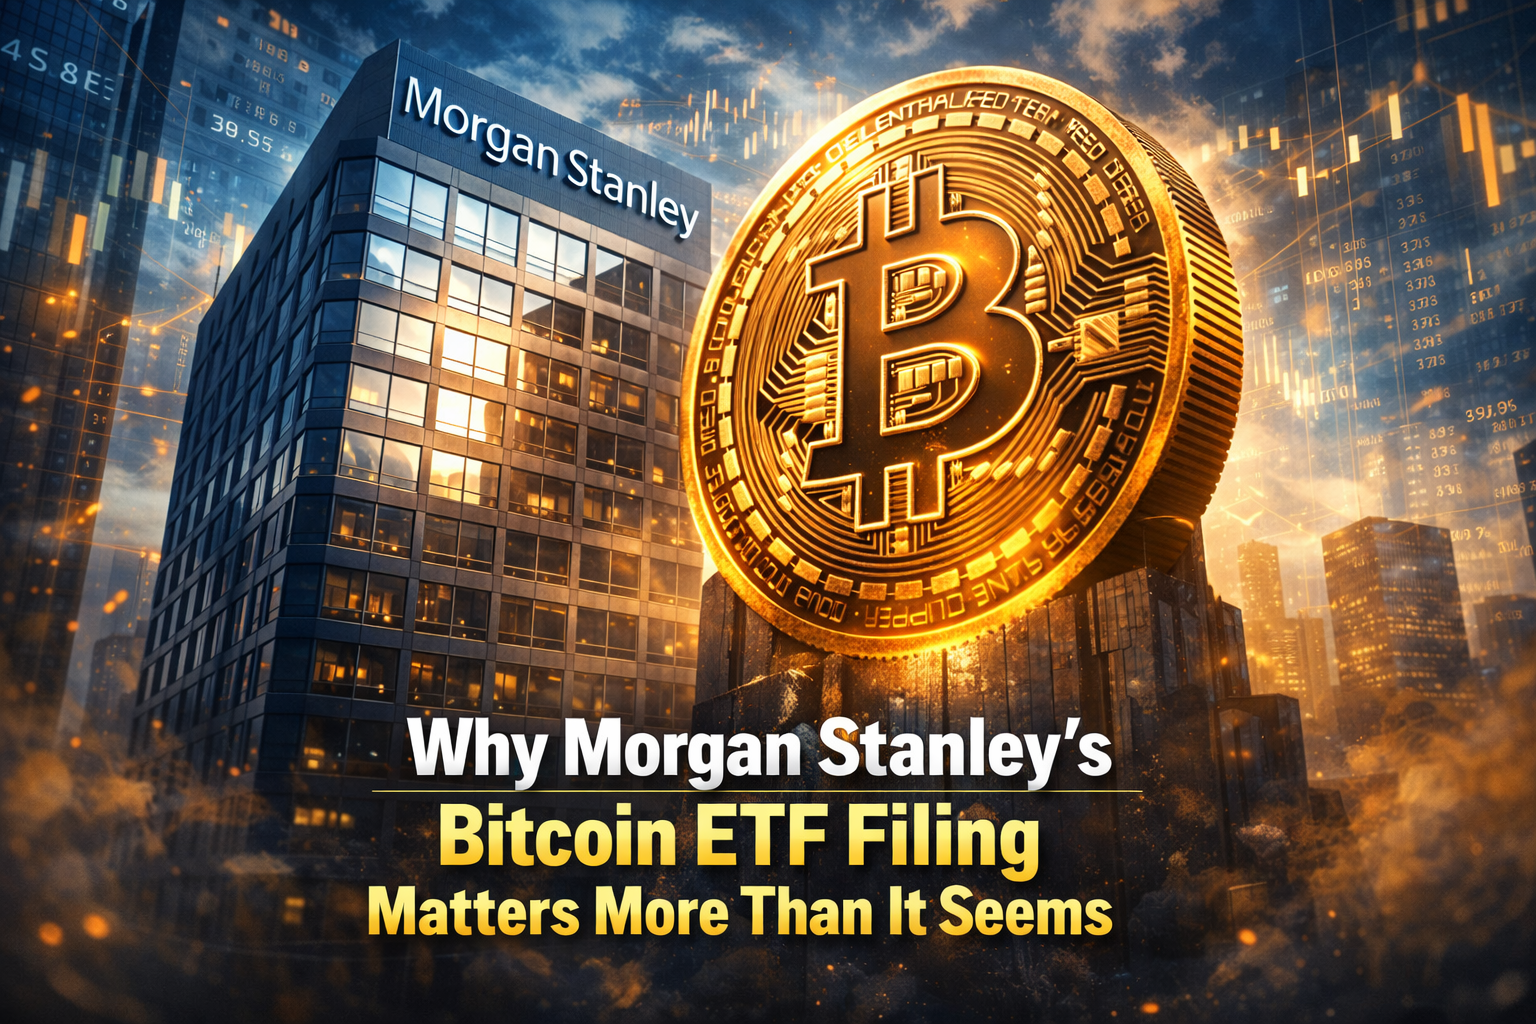
The bullish sentiment among analysts regarding Bitcoin's future price movements is not unfounded. Several factors contribute to this optimistic outlook, including the increasing institutional adoption of Bitcoin, the growing recognition of cryptocurrency as a legitimate asset class, and the innovative developments within the blockchain ecosystem. The introduction of spot Bitcoin ETFs in the U.S., for example, marks a significant milestone, potentially paving the way for broader institutional and retail participation in the cryptocurrency market. This development could lead to increased liquidity and stability, further bolstering Bitcoin's price prospects.
However, the cryptocurrency market remains highly speculative and influenced by investor sentiment. While the narrowing Bollinger Bandwidth indicates a potential for significant price action, the direction and magnitude of this movement depend on a confluence of factors. Market sentiment can be swayed by a range of events, from regulatory announcements to technological breakthroughs, and from macroeconomic shifts to changes in market liquidity. Analysts, while generally optimistic, also caution against the unpredictable nature of the market, advising investors to maintain a balanced and informed approach.
Strategic Implications for Investors and Traders
For investors and traders, the current Bollinger Bandwidth readings offer a signal to be on high alert for potential market movements. However, this signal should not be taken in isolation. Successful market participants often employ a multi-faceted approach, combining technical indicators like Bollinger Bands with fundamental analysis, sentiment analysis, and a keen awareness of global economic conditions. In the volatile world of cryptocurrency, a well-rounded strategy is essential for navigating market uncertainties and capitalizing on potential opportunities.
Moreover, understanding the psychological aspects of market movements can provide additional insights. The market's reaction to the narrowing Bollinger Bandwidth reflects the collective anticipation and anxiety of participants, which can, in turn, influence price movements. By monitoring market sentiment, news flow, and other indicators in conjunction with Bollinger Bandwidth, investors and traders can better position themselves to respond to emerging trends and shifts in market dynamics.
Conclusion
The Bollinger Bandwidth is a powerful tool in the arsenal of cryptocurrency traders, signaling periods of potential market movement. However, the true strength of this indicator lies in its integration with a broader market analysis strategy. Traders should watch for corroborating signals from other technical indicators, stay informed on global economic developments, and maintain a pulse on the cryptocurrency market's sentiment. By doing so, they can enhance their understanding of market conditions and improve their decision-making process.

FAQs
What are Bollinger Bands?
Bollinger Bands are a technical analysis tool created by John Bollinger in the 1980s. They consist of three lines: a middle line representing the simple moving average (SMA) of an asset's price, and two outer bands that represent standard deviations above and below the SMA. These bands help identify the volatility and price levels of an asset.
What is Bollinger Bandwidth?
Bollinger Bandwidth is a technical indicator derived from Bollinger Bands, measuring the percentage difference between the upper and lower bands. A lower Bandwidth indicates less volatility (narrow bands), while a higher Bandwidth indicates more volatility (wider bands).
How can Bollinger Bandwidth signal a potential price surge in Bitcoin?
Historically, periods of low Bollinger Bandwidth (narrow bands) in Bitcoin's price chart have often preceded significant price movements. This is because narrow bands suggest that the market is consolidating, and a breakout is likely. However, while the Bandwidth can signal a potential surge, it does not indicate the direction of the move.
Should I invest in Bitcoin based solely on Bollinger Bandwidth?
No, while Bollinger Bandwidth can be a useful indicator, it should not be used in isolation for investment decisions. It's important to consider other factors and indicators, market sentiment, global economic conditions, and personal investment goals before making any decisions.
Can Bollinger Bandwidth predict the exact timing of a Bitcoin price surge?
No, Bollinger Bandwidth does not provide exact timing for a price surge. It indicates potential volatility and price movements but does not specify when they will occur. Traders often use it in conjunction with other analysis tools and indicators to make more informed predictions.
VISIT OUR STORE

The Best Merch For Bitcoin Maxis
Visit Crox Road Store 👉🏻 https://croxroad.store/